The Activation State of Aurora A Kinase Drives Inhibitor Selectivity
Project Start Date: 2017-02-01
Aurora A as a model kinase for measuring inhibitor-driven conformational effects.
Protein kinase Aurora A (AurA) controls proper separation of chromosomes throughout mitosis. AurA can be activated by either the allosteric binding of its partner protein, Tpx2 (Figure 1B) or by phosphorylation of its activation loop, a dynamic regulatory motif found in all protein kinases (Figure 1 A). These separate activation mechanisms divide AurA into two distinct cellular pools with divergent functions: one that is active along the spindles (purple square) and one that is active at the centrosomes (pink circle) (Figure 1C) (Carmena and Earnshaw 2003)
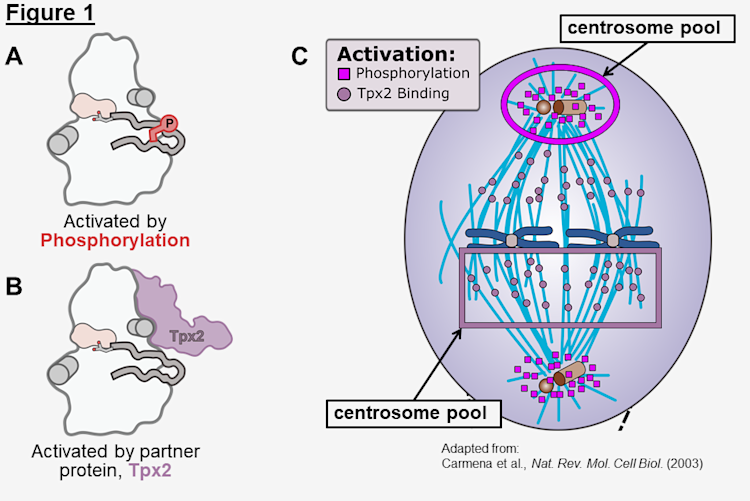
AurA overexpression is present in many cancers, which has made it an attractive target for a considerable number of drug development efforts, though none have yet been approved. Interestingly, Aurora inhibitors have been shown to be exquisitely selective for a single pool of AurA while preserving function of the other pool (de Groot et al 2015). The first major goal of my thesis research was to understand how inhibitors can recognize the phosphorylation-activated state vs the Tpx2-activated state of AurA.
Before we can study structural changes, we must first understand the structural features of the kinase domain that allow us to differentiate between states. In other words, how can we tell when the kinase is "ON" (active) or "OFF" (inactive). In each of the over-500 human protein kinases there are conserved structural motifs that have defined movements relating to their activation state (Huse & Kuriyan, 2002). In AurA, the activation loop undergoes substantial rearrangements that vary between the inactive and active states (Figure 2).
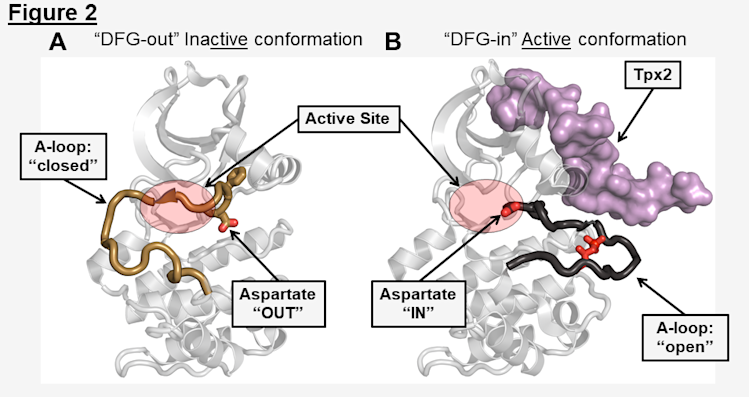
In inactive, "OFF" states called DFG-out, the activation loop is positioned across the activation loop in a "closed" position that blocks the binding of substrates, and the key catalytic aspartic acid of the DFG-motif (an Asp-Phe-Gly region that coordinates ATP binding and is 100% conserved in all kinases ) is positioned "OUT" of the active site (Figure 2A). In the active, "ON" state called DFG-in, the activation loop is in an "open" conformation, allowing substrate binding, and the aspartate is rotated "IN" to the active site to coordinate ATP binding (Figure 2B). Note that even though a kinase may be in the DFG-in conformation, it is not actually active unless ATP is bound in the active site.
Our lab has developed spectroscopic strategies to relay structural information about the kinase, revealing dynamic details that are lost in conventional, static crystallography methods. I use a one-of-a-kind solution-based fluorescence assay that exploits principles of Forster resonance energy transfer (FRET) to track the position of the activation loop, which undergoes dramatic conformational rearrangements when exposed to varying conditions (+/- Tpx2, +/- phosphorylation, +/- inhibitors, etc.) as highlighted in Figure 2. In this format, inactive DFG-out conformations, in which the activation loop is "CLOSED", position the fluorescent dyes in closer proximity such that there is higher energy transfer (Figure 3A), and active DFG-in conformations, in which the activation loop is "OPEN", position the fluorescent dyes further apart such that there is lower energy transfer (Figure 3B).
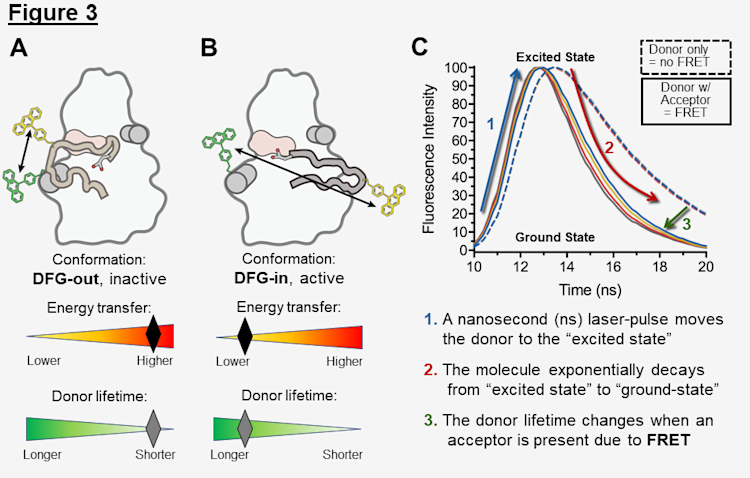
In these experiments, fluorescence intensity is recorded as 1. a nanosecond laser-pulse excites the donor molecule and 2. it returns to the ground state (Figure 3C). The time it takes to decay from excited to ground states is the fluorescence lifetime, which 3. changes due to FRET occurring in the presence of an acceptor (Figure 3C). The lifetime data can be mathematically modeled to reveal the distribution of the distances between donor and acceptor molecules, and further interpreted to the position of the activation loop for AurA molecules, i.e. shorter or longer distances representing conformations of the kinase (Figure 3A,B).
We used this experimental design to capture the conformational dynamics of each of the four activation states of AurA, which are referenced in Figure 1 and shown below in Figure 4A. The inactive state of AurA (Figure 4A,B, Unphos, black) is in a conformational equilibrium between the DFG-out and DFG-n states as represented by the wide distribution shown in Figure 4B. When AurA is activated by phosphorylation (Figure 4A,B, Phos, red), this equilibrium remains largely unchanged. However, when Tpx2 binds unphosphorylated AurA (unphos + Tpx2, yellow) we see the distribution, and the fourth activation state is abnormally present in ~10% of skin cancers that have an inactivating mutation in the phosphatase responsible for dephosphorylating AurA (phos + Tpx2, blue). These measurements were a highly reliable control for defining the baselines of each of the AurA activation states and were very consistent among replicates. Shown are the centers of each distance distribution for 96 individual replicates of each of the 4 biochemical states, demonstrating the consistency of this method (Figure 4C).
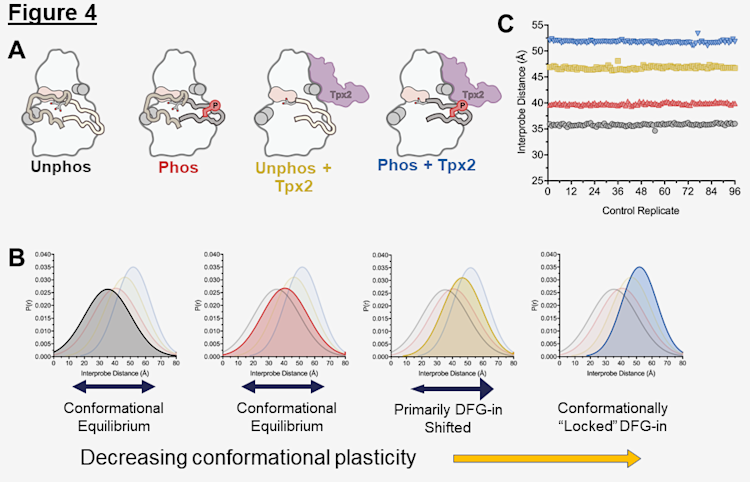
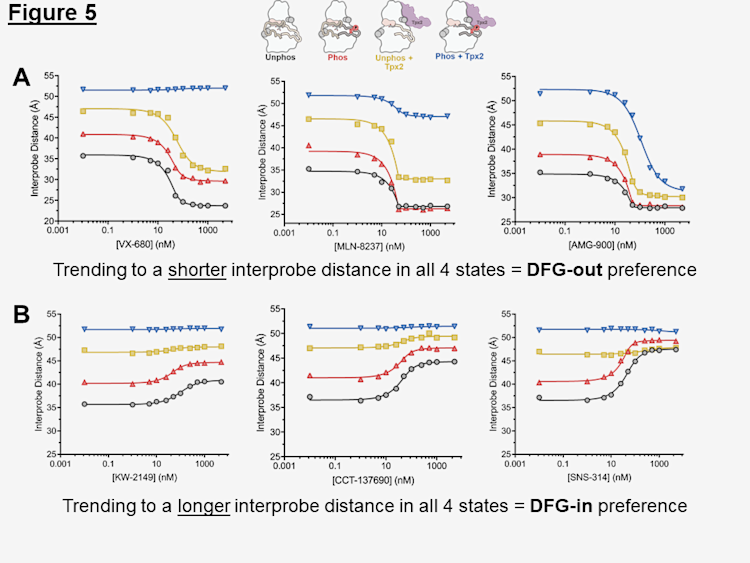
In my paper (Lake et al.), I characterized the structural preference (whether the kinase was shifted towards the inactive or the active state) and binding strength (affinity) of a panel of 24 clinically-relevant Aurora inhibitors in relation to each of the activation states explained in Figure 4. We found that all of the inhibitors in our panel displayed a structural preference to varying extents (a shift towards either the inactive DFG-out or active DFG-in state) , and that structural preference of inhibitors is the norm, rather than the exception as previously thought. This suggests that evolution has fine-tuned kinase structure to such an exquisite balance that any active-site input (e.g. inhibitor binding) produces a structural change.
Furthermore, we found that the activation state of kinase is the key driver of kinase conformation which will ultimately dictate the inhibitor's preference. Shown in Figure 5A are a selection of inhibitors that have varying degrees of preference for the DFG-out, inactive state, organized from weaker to stronger (left to right). The strength of their preference can be visualized by the magnitude of distance change when binding to the Phos + Tpx2 state (blue). Shown in Figure 5B are a selection of inhibitors that have varying degrees of preference for the DFG-in, active state, organized from weaker to stronger (left to right). The strength of their preference can be visualized by the magnitude of distance change when binding to the Unphos state (black).
We also showed that allosteric input from Tpx2 binding has substantial influence on the binding of inhibitors, which we quantified by measuring affinity changes between the inhibitors and Tpx2. In this regime, the simultaneous binding of Tpx2 and an inhibitor either increases or decreases the affinity of both binders. NEED TO COMPLETE THIS SECTION.
FIGURE PENDING
Fundamentally, inhibitors that recognize the active structure of AurA bind stronger in the presence of Tpx2 and are positively cooperative, while inhibitors that recognize the inactive structure of AurA bind significantly weaker in the presence of Tpx2 and are negatively cooperative. In other words, inhibitors that “cooperate” with Tpx2 (both shift the structure in the same direction) bind better to AurA:Tpx2 complex and would be more selective for the spindle pool that is activated by Tpx2. In contrast, inhibitors that “don’t cooperate” with Tpx2 (Tpx2 and the inhibitor play structural tug-of- war) bind worse to the AurA:Tpx2 complex and would be more selective for the centrosomal pool that is activated by phosphorylation.